As digital services evolve and become ever more embedded in social, economic and cultural life, the ability to afford a reliable, quality internet connection and the devices required for social participation has never been more critical.
Since 2014, the Australian Digital Inclusion Index has measured the affordability of internet services across the Australian population. The results have shown that those who experience social and economic disadvantage persistently face an affordability barrier to digital inclusion. Affordability, for these people, is another barrier, in addition to limitations in access to infrastructure and data, and a lack of confidence and capabilities in using digital services.
Some organisations and researchers describe people unable to afford a quality internet connection as experiencing ‘digital poverty’[1]. The effect of digital poverty is that the costs of online connection and digital devices present major barriers to education, work, and vital services, and compound existing inequalities. We refer to this as affordability stress. This may arise where a person is unable to use the internet at home or where opportunities to use the internet may be severely limited by a lack of access to data or a suitable device. These challenges can hinder the development of digital skills and literacies, compounding barriers to social and economic participation and leading to what some researchers have called an ‘inequality loop’[2].
Affordability is a cross-cutting issue in digital inequalities research, often aligned with Access[3]. In the ADII, we treat these two dimensions separately to isolate the impact of economic inequality on digital inclusion. Our Affordability dimension measures the percentage of household income required to gain a good quality service with uninterrupted connectivity. To do this, we consider the price of a bundle of goods and services required for a well-connected household. This ideal internet bundle enables both quality and reliable connectivity through a fast internet connection (such as that provided through a cable HFC service, NBN 50 or above, or 5G wireless service), an unlimited monthly data allowance through a fixed broadband service, and a mobile broadband or mobile phone data allowance above 61 GB per month.
A person with the highest Affordability score would pay 2% or less of their household income for this internet bundle. This is based on an international standard that suggests households ideally should not be paying more than 2% of their income for access[4].
What is affordability stress?
The affordability stress score describes the percentage of household income required for a family or single-headed household to gain access to a defined internet bundle. Affordability stress occurs when lower income groups (typically defined as those in the lowest 40% of the income distribution) must pay a relatively large proportion of their income to access the internet bundle.
The affordability stress score categorises expenditure on the ideal internet bundle in four categories: up to 2% of household income; up to 5% of household income; up to 10% of household income; and more than 10% of household income. Households that would have to pay more than 5% of their household income to access the internet bundle are considered to have ‘low Affordability’ and would be experiencing affordability stress.
Paying more than 5% of their household income on their internet bundle would tip many lower income households into affordability stress, compromising their capacity to pay for other essential household items. To avoid this, many lower-income households may buy cheaper and less capable services, and devices that limit the quality of connections and opportunities for internet use.
What does Affordability look like now?
Between 2021 and 2023, Affordability scores have seen significant shifts compared to previous years. These shifts are positive, with improvements in Affordability scores across most regions and social groups, including for those on the lowest incomes. However, while Affordability has improved at a national level, some groups continue to experience high levels of affordability stress. Results for Affordability have fluctuated in previous Index reports, and we will continue to track the data to judge whether we are seeing the beginnings of a long-term improvement in 2023 or a shorter-term change related to the unusual economic and market conditions of the pandemic period.
Based on our Affordability measure, 4.3% of Australians would need to pay more than 10% of their household income to gain quality, uninterrupted connectivity, falling from 14.1% in 2021. This improvement is the result of reductions in the cost of our bundle of internet services. Nevertheless, 27.6% of Australians experience affordability stress, meaning that accessing a quality internet connection and necessary devices would compromise their capacity to pay for other essential household items. While this figure has fallen from 39.2% in 2021, it remains an important issue for understanding digital inequality in Australia.
These affordability gains are not evenly distributed (see Figure 1). For Australians in the lowest income quintile, most (72.9%) would have to pay more than 10% of their household income to gain a quality internet connection. All Australians in the lowest income quintile, and 48.3% of those in the second lowest, would have to pay more than 5% of their household income to gain quality, uninterrupted connectivity. The situation for those in the second lowest quintile has improved since 2021, when 84.1% would have had to pay more than 5% of their household income for a standard internet bundle.
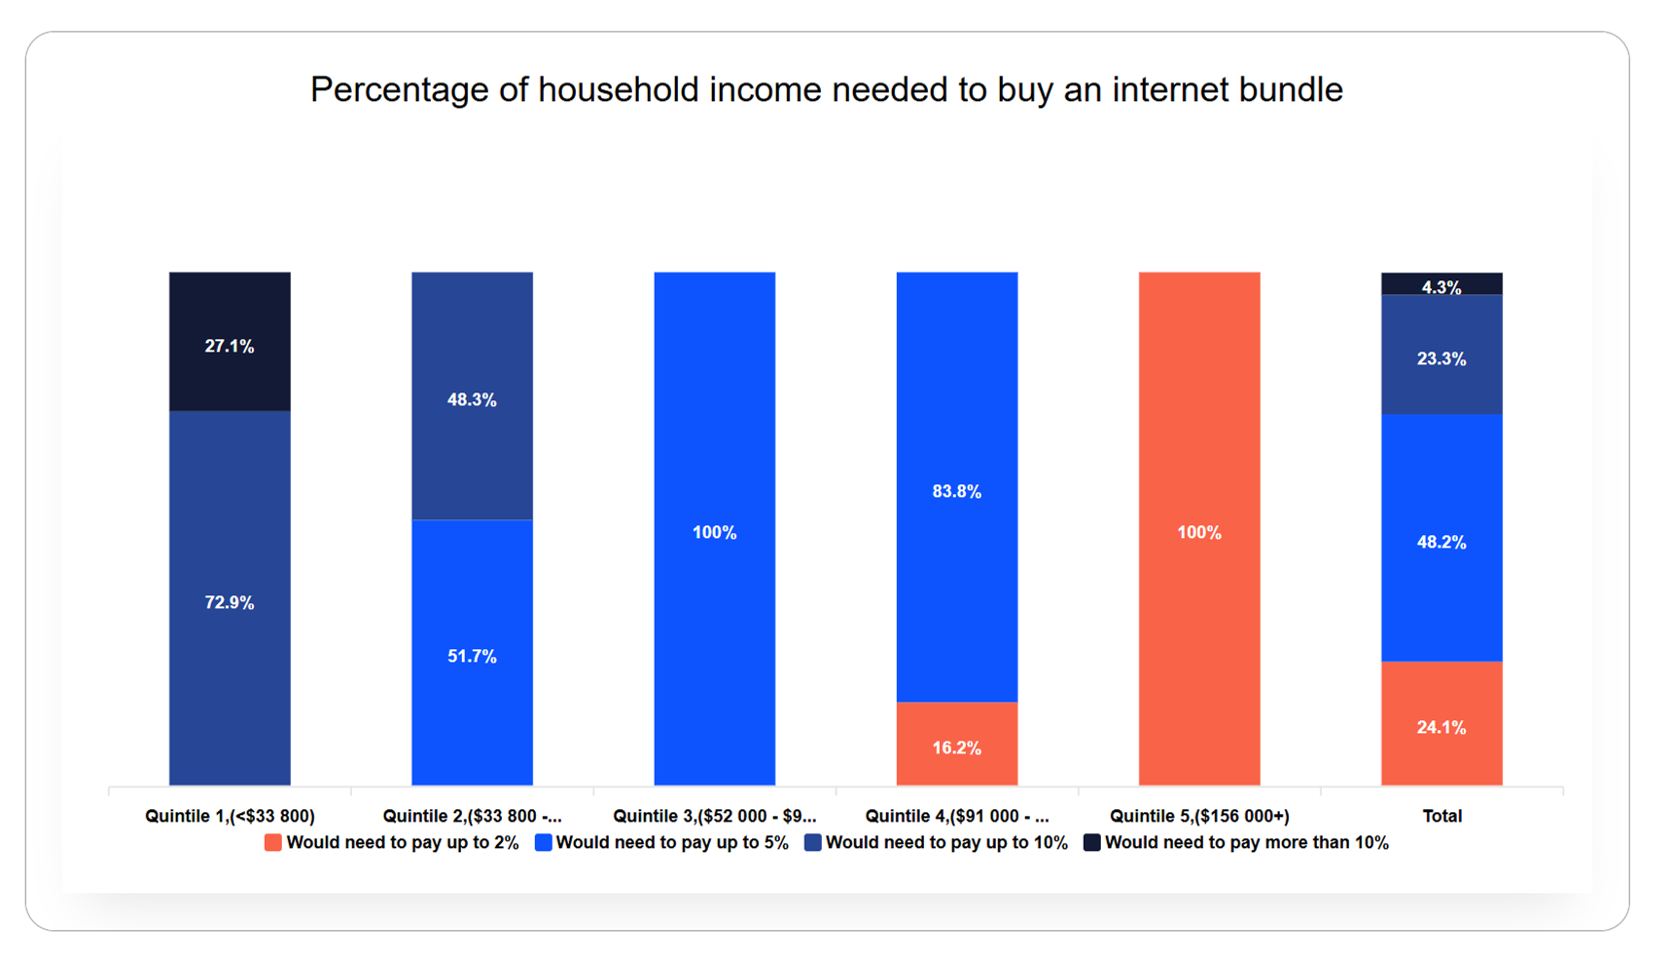
Figure 1: Percentage of household income needed for a standard internet bundle, by income quintile.
Who is affected by affordability stress?
Some Australians are particularly sensitive to affordability stress, including people with disability (55.1%), living in public housing (64.1%), over 75 years old (65.2%) and currently unemployed (69.4%). Table 1 shows groups where at least half would have to pay more than 5% of their household income to obtain and maintain quality, reliable connectivity. As in other dimensions of the Index, we continue to see that digital inequalities relate strongly to socio-economic inequalities.
Table 1: Groups where at least half have would have to pay more than 5% of their household income to maintain quality, reliable connectivity.
| Subgroup | Affordability score |
Percentage of group that would have to pay more than 5% of household income to maintain quality, reliable connectivity |
|---|---|---|
|
Income Q1 (<$33,800) |
84.6 |
100% |
|
Unemployed |
86.7 |
69% |
|
75+ years |
92.7 |
65% |
|
Rent from public housing authority |
90.5 |
64% |
|
Receive income support |
92.3 |
63% |
|
People with disability |
91.5 |
55% |
|
Did not complete secondary school |
91.7 |
55% |
|
Not in labour force |
92.3 |
53% |
|
First Nations |
89.0 |
52% |
The impact of cost on internet access and use
In addition to measuring affordability stress, we also consider whether the cost of the internet may be a reason for limiting internet use. Some groups report experiencing internet costs as prohibitive. For example:
- 6% of First Nations respondents reported cost as a reason for limiting internet use, compared to 5.7% of other Australians.
- 3% of unemployed respondents reported the cost of internet access as inhibiting use, compared to 4.9% of employed respondents.
- 1% of respondents in very remote areas reported the cost of internet access as inhibiting use, compared with 5.7% of respondents in major cities, 4.2% in inner regional Australia, 11.7% in outer regional Australia, and 7.1% in remote Australia.
Compared to households in cities, rural households often have to pay more for less (in terms of data, speed, reliability, and service) due to a range of factors, including a lack of both competition and infrastructure[5]. While a range of government and public-private initiatives have sought to improve access in rural areas in recent years, particularly on transport corridors, a clear geographic affordability divide persists.
We also asked participants how often they had to sacrifice or cut back on essential household costs (such as food or utilities) to be able to afford personal or household internet access. Some groups were more likely than others to have to cut back to afford connectivity:
- Nationally, 11.7% of First Nations respondents had to ‘often’ or ‘always’ sacrifice on essentials to afford internet access, compared with 4.9% of other respondents.
- 6% of unemployed people had to often or always cut back, compared to 4% of employed people.
As illustrated in Figure 2, a larger number of those on lower incomes had to cut back on essentials to remain connected, compared to those on higher incomes.
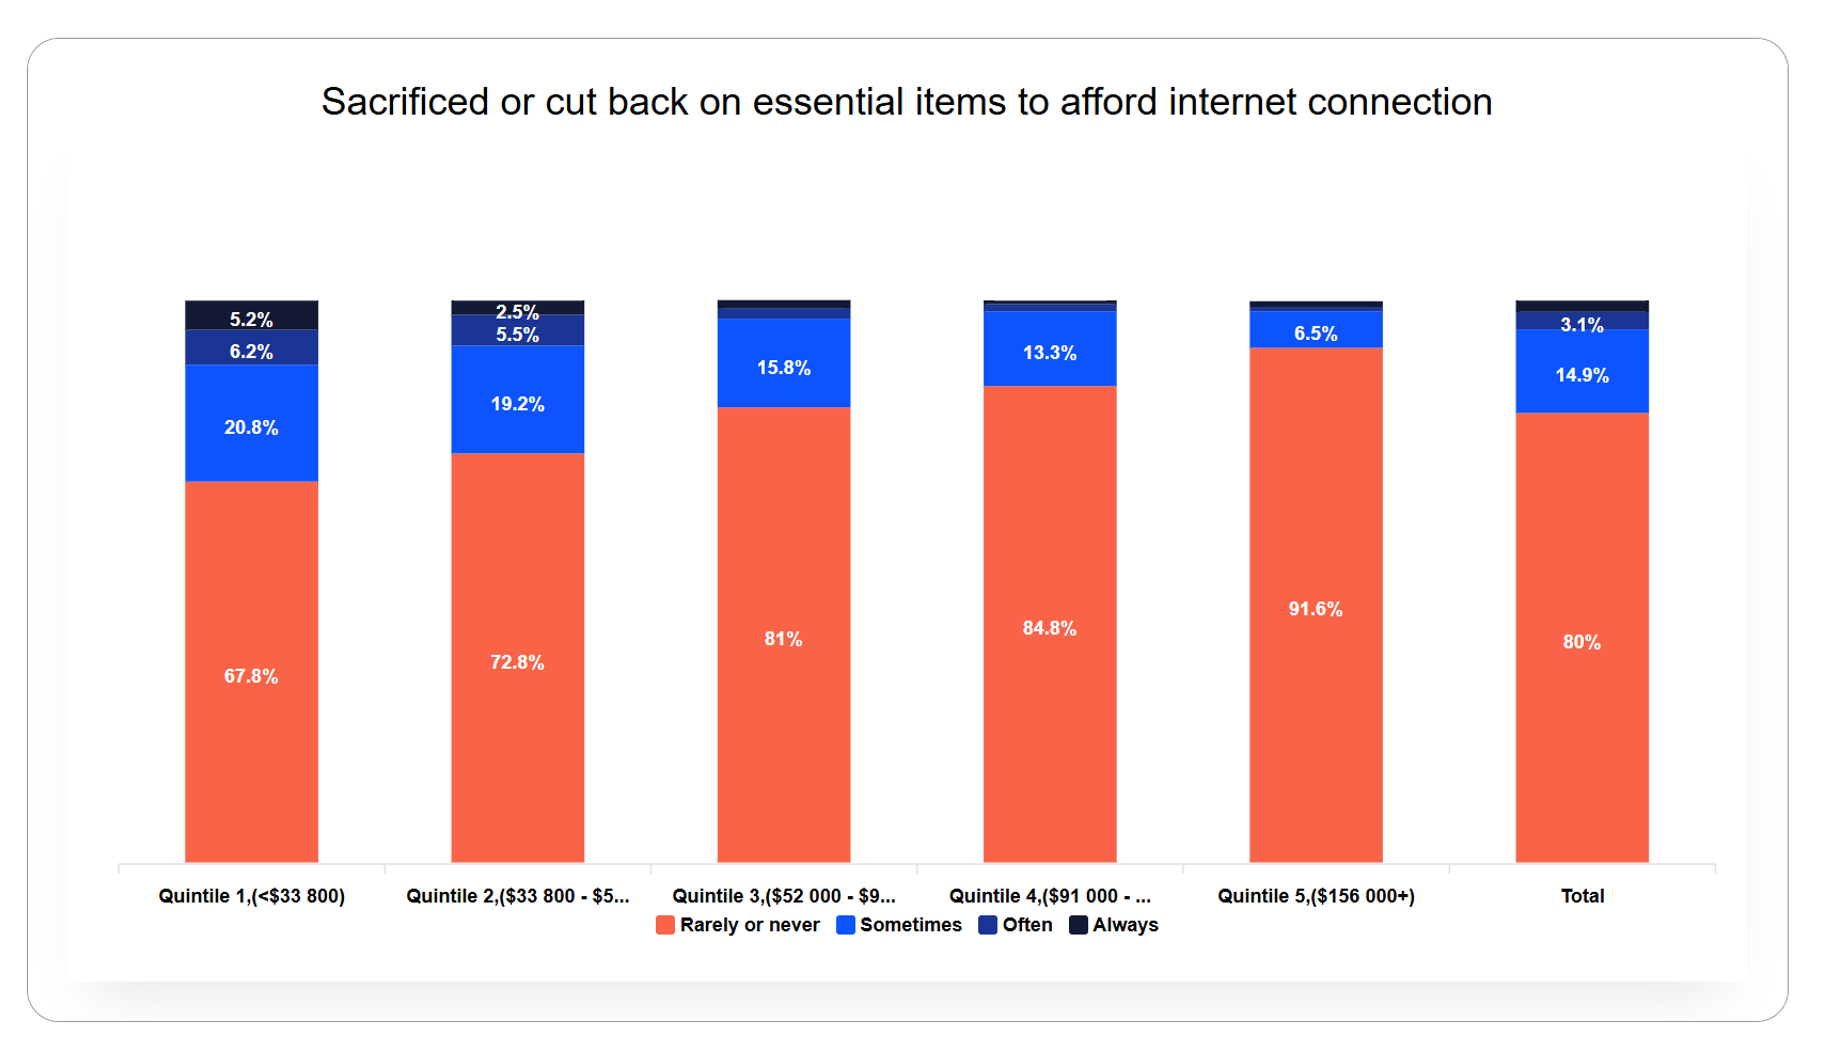
Figure 2: How often respondents had to sacrifice or cut back on essential household costs (e.g. food or bills) to be able to afford personal or household internet access in the past six months, by income quintile.
Our approach of measuring income at a household level has limitations. Figure 2 shows that people, especially those on lower incomes, may need to make difficult choices to prioritise internet connectivity. Households with a large number of adult occupants on low individual incomes can artificially push up household incomes. Meanwhile, groups with higher numbers of mobile-only users (including people in very remote areas and those on low incomes) tend to pay for internet connectivity as individual subscriptions, rather than as shared home fixed broadband. For this reason, understanding lived experience and people’s skills, strategies, and priorities in the face of inequalities remains critical[6].
There is often substantial labour involved in managing connectivity and data use. For example, research has shown that households with limited access to the internet use a range of practices to manage and extend their data, such as making use of free public Wi-Fi or library internet services, or toggling their data connection on and off throughout the day[7]. Others limit their phone use as much as possible when not connected to Wi-Fi. Some avoid activities they know use a lot of data, such as streaming or using social media platforms, when they are nearing data limits. Many low income households further manage affordability stress by cutting back on groceries and petrol, postponing payment of bills, postponing replacement of digital devices or cancelling subscription services.
Next steps
Affordable internet access is essential for the use of an increasing range of basic services. Positive improvements in Affordability are encouraging, but continued close attention needs to be given to the pricing of such services given the levels of affordability stress reported here, together with rising cost pressures for other basic household goods and services. Ongoing data collection and reporting will determine whether the 2023 results represent a short or long-term improvement.
It is important that we continue to understand affordability in relation to people’s household circumstances, rather than seeing internet access as a personal service. For most households, mobile services do not provide an alternative to fixed broadband connections; these different modes of access are better understood as providing complementary capabilities. It is therefore important that we understand affordability generally in terms of the costs of both mobile and fixed broadband, rather than one or the other in isolation. Pricing for both mobile and fixed services should be recognised as critical concerns for low income Australians.
A range of initiatives, from community Wi-Fi to the provision of free devices to unconnected families, can contribute to relieving affordability pressures. There is scope to extend and expand these initiatives. However, affordability is a continuing challenge. Further action directly addressing the needs of low income Australians for both fixed and mobile services will be necessary to disrupt cycles of digital disadvantage.
References and footnotes
[1] Massimo Ragnedda et al., ‘Living on the Edge of the Digital Poverty’ (British Academy, 2022), https://thebritishacademy.ac.uk/publications/living-on-the-edge-of-digital-poverty/
Jonathan Digby et al., ‘Understanding Digital Poverty and Inequality in the UK’, Report (The British Academy, 25 November 2022), United Kingdom, https://apo.org.au/node/320897.
[2] Ragnedda, Ruiu, and Addeo, ‘The Self-Reinforcing Effect of Digital and Social Exclusion’.
[3] Helsper, The Digital Disconnect : The Social Causes and Consequences of Digital Inequalities, chap. 3.
[4] Broadband Commission for Sustainable Development, ‘2025 Targets: Connecting the Other Half’, Broadband Commission (blog), 2023, https://www.broadbandcommission.org/broadband-targets/
Alliance for Affordable Internet, ‘Affordable Internet – Journey from 1 to 5’, Alliance for Affordable Internet, accessed 9 June 2023, https://a4ai.org/affordable-internet-journey-from-1-to-5/
[5] Robert Breunig and Owen McCarthy, ‘Household Telecommunications Expenditure in Australia’, Telecommunications Policy 44, no. 1 (1 February 2020): 101837, https://doi.org/10.1016/j.telpol.2019.101837
Marshall et al., ‘Connectivity and Digital Inclusion in Far North Queensland’s Agricultural Communities’.
[6] Van Holstein et al., ‘The Alternate Infrastructures That Support Digital Counter Publics’.
[7] Jenny Kennedy et al., ‘Telstra Connected Students – Lessons for Digital Inclusion’ (Melbourne, Australia: Telstra and RMIT University, 2022), https://digitalinclusionindex.org.au/wp-content/uploads/2022/10/Telstra-Connected-Students-Report.pdf
Jenny Kennedy, Indigo Holcombe-James, and Kate Mannell, ‘Access Denied: How Barriers to Participate on Zoom Impact on Research Opportunity’, M/C Journal 24, no. 3 (21 June 2021), https://doi.org/10.5204/mcj.2785.